
The USA is often referred to as the fast-food giant and Americans as the biggest consumers of junk food. According to that, it is no wonder that the US fast-food industry revenues billions of dollars per year.
But how much is that exactly? Is the industry growing? How often do Americans consume fast food?
In this article, we answered those and many more questions you may have about the US fast food industry.
5 Key US Fast Food Industry Statistics
- The US fast food industry made $278 billion in 2021.
- The industry has 3,450,120 employees.
- Alabama has 6.3 fast-food restaurants per 10,000 residents.
- Subway is the largest franchised store in the US.
- The fast-food meal price increased by 6% due to the pandemic.
15 US Fast Food Industry Statistics
1. The fast-food industry revenue is $278 billion in 2021.
According to the study by IBISWorld, the US fast-food industry made quite a good revenue for 2021. At the moment, the revenue is estimated to be $278 billion.
Source: IBISWorld
2. The US has 196,794 fast-food franchises.
The United States is often referred to be a fast-food giant. It has 196,794 fast-food franchises and the most junk food consumers in the world.

Source: Statista
3. The fast-food industry in the US is growing by an annual rate of 4.6%.
The study showed that the fast-food industry in the US has a steady annual growth rate of 4.6%. Some predictions say that this rate will have a great increase in the upcoming years.
Source: Zippia
4. The market size of the US fast-food industry is expected to increase by 15.8% in 2021.
The year 2021 has certainly been rough, but not for the fast-food industry. This ever-growing sector is expected to have up to 15.8% of growth this year.
Source: IBISWorld
5. The fast-food industry in the US accounts for 32.7% of the global fast-food revenue.
The percentage speaks for itself – the US has a huge part and share in the global revenue of the fast-food sector.
Source: SpendMeNot
6. The US fast-food industry employs 3,450,120 individuals.
This number isn’t that surprising due to the fact that America has a great number of fast-food franchises and thanks to that, it can offer a high number of new job openings and employment.
Source: Zippia
7. California and Texas have the most fast-food employees.
According to the U.S. Bureau Of Labor Statistics, we gathered the data about the specific numbers of fast-food employees. At the moment, California has 384,860 employees in the fast-food industry, while Texas has 380,090.

Source: U.S. Bureau Of Labor Statistics
8. Around 51.2% of fast-food workers are women.
Out of the great number of fast-food employees, it turns out that more than half of them are women (51.2%) compared to 43.5% of employed men.
Source: Zippia
9. Alabama has the most fast-food restaurants in America per capita.
Datafiniti made a study and found out that in Alabama, there are 6.3 fast-food restaurants per 10,000 residents.
Source: Datafiniti
10. There has been an 11% increase in selling plant-based fast food.
Every day, more and more restaurants are starting to offer vegan fast food options. Plant Based Foods Association made a study back in 2019 and found out that there has been an 11% increase in retail sales of plant-based food.
Source: Plant Based Foods Association
11. Subway is the largest franchised store in the US.
With 25,908 restaurants all around the country, Subway is the largest franchised store in the United States, which came as a bit of a surprise since McDonald’s is the most popular fast-food chain in the world.
Source: Zippia
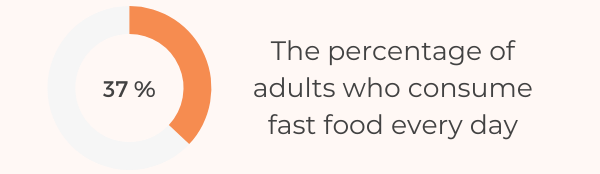
12. Around 37% of adults consume fast food every day.
Americans are definitely the biggest fast-food consumers in the world so the fact that 37% of adults consume fast food on a daily basis isn’t that surprising.
Source: CNN Health
13. An average American spends $1,200 on fast food per year.
The study made by Zippia showed that approximately $1,200 is spent per person in one year in a fast-food restaurant.
Source: Zippia
14. The high number of 88.5% of fast-food consumers started going to the drive-thru during the pandemic.
COVID-19 pandemic definitely contributed to the increase in the popularity of fast-food restaurants. According to Statista, instead of going to the restaurants to eat, 88.5% of fast-food consumers started using pickup/drive-thru.
Source: Statista
15. The meal price increased by 6% due to the pandemic.
Pandemic has affected the fast-food meal price. Usually, a meal costs $5 to $7. The price has risen during the COVID-19 pandemic by an average of 6%.
Source: Zippia
To Wrap It Up
Speaking of the fast-food giant, we finally discussed the US fast-food industry, market, and consumption. All the statistics and data we collected contribute to the popularity of the fast-food chains in America. Its market has a big influence and market share in the global industry and its value certainly hasn’t reached its peak yet.