
Eating out has always been one of the favorite activities of the pre-pandemic world. Many people choose to dine out because it is comfortable, while others think of it as an essential part of their lifestyle.
How many people eat out and how often? How much money is spent on eating out? Do men or women eat more often at restaurants?
In today’s article, we’re going to cover all the data, facts, and statistics regarding eating out.
Keep on reading and find all the answers to your questions.
6 Key Eating Out Statistics & Data (Editor’s Pick)
- By 2027, the restaurant industry will be worth $1.7 trillion.
- 56% of people eat out two or three times a week.
- 49% of Canadians eat dinner outside their home.
- 72% of Millennials go out to eat or drink at least once per week.
- 72% of people with children dine out at least once a week.
- Men eat out and spend more than women in restaurants.
21 Eating Out Statistics
1. For 2020, the market size of the full-service restaurant industry was estimated to account for $1.2 trillion.
According to the data provided by Statista, the market size of the full-service restaurant industry worldwide was estimated to account for $1.2 trillion in 2020. However, it is also estimated that by 2027, this figure will grow to as much s $1.7 trillion. A full-service restaurant is a restaurant where meals are primarily prepared individually for the customers and served to them at their table. A fast-food restaurant is not considered to be a full-service restaurant.
Source: Statista
2. The US restaurant industry made a total of $789 billion in 2021.
The United States is not only considered to be a fast-food giant, but also a restaurant giant. According to the National Restaurant Association, restaurant and foodservice industry sales in 2021 in the United States will total $789 billion. The State of the Report Industry Mid-Year Report states that the US had a high revenue due to millions of people eating out.
Source: National Restaurant Association
3. Quick-service restaurant industry had a decrease of almost $1 billion since 2019.
If we’re talking about quick-service restaurants, also known as fast-food restaurants, the market size has seen a high decrease in the last couple of years. In 2019, the market size of this industry reached its peak at $868.1 billion. Once the COVID-19 pandemic hit, this figure decrease to $736.1 billion in 2020. However, the market was forecasted to reach $797.6 billion in 2021. And no doubt that the report for that year will be quite pleasing once it is available.
Source: Statista
4. Total revenue of the QSR industry in the US has dropped by almost $40 billion in a one-year period.
When it comes to the quick-service industry in the US, it has also seen a high decrease. In 2019, the total revenue of the QSR industry was $273 billion. That figure dropped to $239 billion in 2020. The main reason for such a decrease was the COVID-19 pandemic. Due to lockdowns, restaurants couldn’t operate as they would normally do, besides, once they did open, people were too scared to go and eat out. However, they did order online food delivery but that market couldn’t make up for all the in-the-house orders.

Source: Statista
5. More than 50% of people dine out up to 3 times a week.
According to the survey conducted by Acosta, 56% of people eat out two or three times a week. And that is a lot. 10% of the survey’s respondents stated that they dine out four to six times a week, while 6% said they do it every day. These are rather high percentages of people who have the habit of eating out instead of preparing a homemade meal more frequently. Not only that option is less expensive, but it is also a lot healthier than a restaurant’s meal.
Source: Acosta
6. People spend 94% more money on food away from home.
The data from the report provided by Nielsen stated that the total amount of money spent on food “away from home” has grown by 94% since 2003. That is a high growth rate of money spent on dining at the restaurant. The problem is that eating out has become a habit for most people, making them spend tons of money on food.
Source: Nielsen
7. More than 60% of Americans eat out at least once a week.
According to the ICSC survey, 64% of American adults spend money on dining out at least once a week. That percentage presents 163 million people. Dining out once a week is actually quite acceptable, especially compared to those people who eat 4 or 6 times a week outside their house.
Source: ICSC
8. Eating out is a part of Americans’ lifestyle.
However, most Americans don’t eat out because they don’t have time to cook or they just need to grab a quick snack. According to the ICSC survey, almost 50% of adults in the US stated that dining out is an essential part of their lifestyle. And that is that habit we already mentioned in the previous paragraphs.

Source: ICSC
9. In the US, a person spends around $71 per week on eating out.
The mentioned ICSC survey stated that Americans spend a lot of money on dining out. The data says that on average, Americans spend $71 on a weekly basis for eating at a restaurant. If we’re talking about annual spending, the dining expenditure exceeds $602 billion a year. That amount is only for dining out. Imagine the total cost when all other expenses come to account.
Source: ICSC
10. An average American eats up to 18.2 meals per month in restaurants.
The data provided by The Simple Dollar states that an average American eats around 4.2 commercially prepared meals per week. People eat at a restaurant 4 to 5 times a week and that number equates to 18.2 meals per month which are eaten outside the home.
Source: The Simple Dollar
11. In 2018, an average US household spent $3,459 on food outside the home.
Back in 2018 and according to the data by the U.S. Bureau of Labor Statistics, the average US household spent an average of $3,459 on fast food meals, takeout, and in-restaurant dining. No doubt that amount would increase if there wasn’t the COVID-19 pandemic and its impact on the economy and restaurant industry.
Source: U.S. Bureau of Labor Statistics
12. Alaskans spent more than $3,000 per year on eating out in 2019.
According to Business Insider and their data from 2019, Alaskans spent an average of $3,572 per year on eating out. The statistics indicate that 7 more states spend over $3,000 on eating out. Some of the states are New York, Massachusetts, and Wyoming. According to Business Insider, Nevada, Arkansas, and Mississippi are among states that are not willing to pay over $2,000 for such meals.

Source: Business Insider
13. Canadians love to eat dinner at restaurants.
Back in 2019, The Grower reported that more than half of Canadians eat out or buy takeout food at least once every week. The same report stated that 49% of Canadians said they mostly eat dinner outside their home. 39% of Canadians said they eat out less than once a week, while 8% of them reported they didn’t eat out a month prior to the survey.
Source: The Grower
14. More than 70% of Millennials eat out at least once per week.
QSR Magazine reported that millennials are more likely than Gen X and baby boomers to eat out. According to the report, 72% of Millennials go out to eat or drink at least once per week. On average, they spend $139 at restaurants every single month.
Source: QSR Magazine
15. People eat out because it is convenient.
According to the survey conducted by ICSC, the top reason for dining out is convenience. Many consumers are looking for ways to save time and energy, and they simply don’t feel like spending hours in the kitchen. The survey stated that 72% of people with children dine out at least once a week. 41% of people stated they’re eating out more often than they did 2 years ago. The ICSC survey also showed that Millennials are frequently going to food and beverage places. 72% of them visit such establishments at least once a week.
Source: ICSC
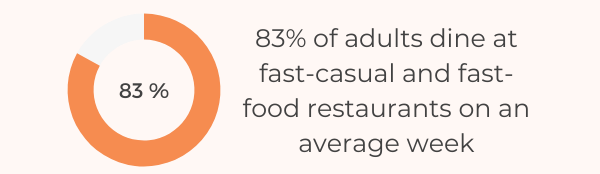
16. More than 80% of adults eat fast food on an average week.
The ICSC study stated that in an average week, 83% of adults dine at fast-casual and fast-food restaurants. A fast-casual restaurant offers a higher quality of food than a fast-food restaurant. It has an intermediate concept between fast food and casual dining. However, that is a high percentage of people who eat some sort of fast food meal.
Source: ICSC
17. Despite frequent food ordering and delivery, people often visit restaurants too.
Despite the increase in the popularity of takeout and food delivery, 67% of people continue to dine at full-service restaurants every week. However, more than 60% of consumers said that even though they use delivery and takeout more frequently in the last years, they aren’t going to physical restaurants any less often.
Source: ICSC
18. Americans with lower income spend the most money on dining out.
Americans do love to eat at restaurants. According to the Fourth survey, people with an income between $50,001 and $60,000 ate out the most – just under 4 times per week. However, people who earned less money than those people (between $40,0001 and $50,000) actually spent the most money on dining out. According to the data, they spend an average of $117.82 per week, which would be 12%-15% of their annual income.
Source: Fourth
19. More than 40% of Millennials love the convenience of eating out.
Speaking of costs and spendings, Millennials spent the most money on dining out. Fourth data stated that they spend an average of $95 each week on eating at the restaurant. 43% of Millennials eat out for convenience, while 49% of them eat in restaurants because it provides a social setting for them to spend time with family and friends.
Source: Fourth
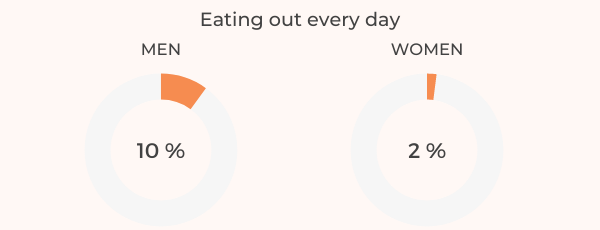
20. Men love to eat out and spend more money at restaurants.
If we’re going to focus on gender, men eat out more than women. According to the data provided by Fourth, men typically eat out 3.45 times a week, while women eat 2.15 times a week. 10% of men eat out every day, compared with 2% of women who do the same. Besides the fact that men eat out more, they also spend more money on such activities than women. Men spend an average of $82 per week on dining out, while women spend $69.
Source: Fourth
21. Despite the pandemic, 60% of consumers are feeling comfortable dining out.
COVID-19 pandemic had a massive impact on the restaurant industry and people eating out. However, the last report by Morning Consult stated that 60% of consumers are comfortable dining out despite the pandemic. 73% of consumers predict they’ll feel comfortable eating at a restaurant within the next six months. In the year 2020, only 42% of people said they would feel safe dining out and that percentage was never passed that year. In 2021, the percentage has been increasing steadily throughout the entire year.
Source: Morning Consult
To Wrap It Up
Dining at a restaurant has definitely been impacted by the ongoing COVID-19 pandemic. However, people are feeling safer and more comfortable going back to restaurants as time goes by. There is no doubt that the restaurant industry will have a massive growth in popularity and consumers once the pandemic is over and restaurants can offer safety once again. Besides, the revenue of the industry is still high due to online food ordering and delivery, but it will definitely see a high growth rate once everything gets back to normal.