
We all know that the restaurant industry is big and worthy. But what numbers are we talking about exactly? The restaurant industry consists of full-service restaurants and quick-service restaurants also known as the fast-food sector. And millions of people around the world enjoy eating out a couple of times a week.
What are the actual numbers behind the total restaurant industry? How many people dine out? Do they consume fast food on a regular basis? What are the employment rates in this industry?
In today’s article, we’re going to talk about all the statistics, data, and facts behind the enormous and billion-dollar-worth industry.
Here are the topics that we will cover:
- General Restaurant Industry Statistics
- US Restaurant Industry Statistics
- Restaurant Sales Statistics
- Restaurant Online Ordering & Delivery Statistics
- Fast Food Restaurant Statistics
- Restaurant Marketing Statistics
- Restaurant Employment Statistics
- Restaurant Consumer Statistics
Top 13 Restaurant Industry Statistics (Editor’s Pick)
- In 2020, the full-service restaurant industry was worth $1.2 trillion.
- QSR industry alone is worth almost $800 billion.
- 25% of restaurants compost in order to reduce food waste.
- 94% of diners base their dining decisions on online reviews.
- Restaurants with digital orders have 14% higher check sizes.
- In the US restaurant industry works 10% of the nation’s workforce.
- Online food delivery generates more than $26.5 billion.
- Almost 80% of people have a restaurant app for online ordering.
- Contactless delivery is a must for 71% of consumers.
- The fast-food sector accounts for 50% of sales in the industry.
- 67% of restaurants pay for social media ads.
- The employee turnover rate in the restaurant industry is 75%.
- Americans eat around 18.2 meals in restaurants per month.
General Restaurant Industry Statistics
1. In 2020, the market size of the full-service restaurant industry was $1.2 trillion.
According to data provided by Statista, in 2020, the market size of the full-service restaurant industry on a global basis was estimated to account for $1.2 trillion. By 2027, it is projected that the industry will be worth up to $1.7 trillion. The full-service restaurants are places where meals are primarily prepared individually for the customers and such meals are served to customers at their table. It is important to say that fast-food restaurants aren’t considered full-service restaurants.
Source: Statista and Law Insider
2. QSR industry alone is worth almost $800 billion in 2021.
Fast-food restaurants are named quick-service restaurants. The fast-food or QSR industry reached its peak in 2019 with $868.1 billion. The COVID-19 pandemic impacted the revenue of the industry and in 2020, the total figure decreased to $736.1 billion, while in 2021, the industry grew again and it was estimated that its revenue will be $797.7 billion.
Source: Statista
3. Restaurant industry in the US makes up 4% of the country’s gross domestic product.
The United States is known for many restaurants, especially fast-food ones. It is projected that the annual sale in the restaurant industry in the US is around $863 billion. Such a high revenue makes up 4% of the country’s gross domestic product. The fast-food industry alone had a total of $278.6 billion in 2021 thanks to McDonald’s, Starbucks, Taco Bell, and Chick-Fil-A, which lead the market there.

Source: On the Line
4. China has the largest foodservice market.
The data provided by ReportLinker stated that the United States, China, Japan, and Europe are the key foodservice markets. According to their statistics, China has the largest foodservice market in the world which had a massive increase in the last couple of years. The United States was projected to have a steady growth too, while the foodservice industry in Japan is among the biggest industries there.
Source: ReportLinker
5. McDonald’s is the most valuable restaurant brand worldwide.
Amongst all the restaurants in the world, the most valuable one is McDonald’s. McDonald’s is a global foodservice retailer that has more than 39,000 restaurants worldwide. The company is increasing the number of opened restaurants every year for the last 16 years. McDonald’s is also the chain restaurant with the highest sales in the United States.
Source: Statista
6. The United Kingdom has almost 110,000 restaurants.
Even though the United States first comes to mind when speaking of the massive restaurant industry, the UK has a nice number of such restaurants too. According to data provided by Food Hygiene Company, the UK has 108,982 restaurants and cafes. Speaking of full-service restaurants, the UK has 35,770 such places. The country’s industry is worth over £40 billion.
Source: Food Hygiene Company and IBISWorld
7. About 25% of restaurants compost in order to reduce food waste.
Food waste is a big problem in the restaurant industry. 1.3 billion tons of food go to waste every year. Even though restaurants try to limit such food losses by diverting expiring groceries to the people in need, that is not possible due to safety regulations. Now, in order to reduce food waste, 28% of restaurants repurpose food trimmings, while 26% of them offer varied portion sizes. 25% of restaurants compost too.
Source: On the Line
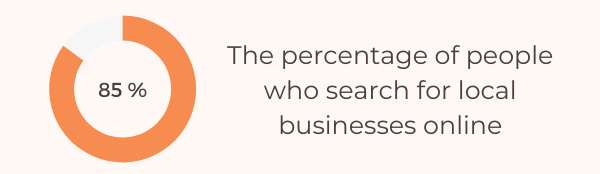
8. Most people search for local businesses online.
Local businesses had and still have the full support of the community during the COVID-19 pandemic. The same goes for local restaurants and online information is much needed, especially now. Most people, or to be more specific, 85% of them search for local businesses online. Due to that, it is important for restaurants to have a website or a social media profile to make it easier for customers to find them.
Source: Reach Local
9. Almost 50% of people search Facebook for restaurants.
Social media is important for any type of business and the same goes for the restaurant industry. According to the data provided by Mashable, 49% of people search Facebook to find restaurants. It isn’t only about finding a restaurant but also about reading the restaurant reviews, customer service, and more, much much more. Social media plays a huge part in the restaurant industry.
Source: Mashable
10. Twitter is one of the most popular platforms for restaurants consumers.
If we compare all the social media and the industries’ engagement on such platforms, Twitter is amongst the most popular ones. When it comes to the restaurant industry, Twitter users have the highest engagement with such an industry.
Source: Adweek
11. More than 90% of people read restaurant reviews.
We already mentioned how important it is to engage with consumers through the business website or social media. According to the Upserve data, 92% of diners actually read restaurant reviews and reviews are one of the main factors of the decision on whether or not a consumer will visit a restaurant or not.
Source: Upserve
12. About 94% of diners base their dining decisions on online reviews.
Speaking of reviews and their importance, the Lunchbox stated that 94% of the US restaurant industry diners base their dining decisions on online reviews. 94% of them! That is a high percentage to look at and it is the best indicator of the importance of having an online profile or a website in the restaurant business.
Source: On the Line
13. Restaurants with digital orders have 14% higher check sizes.
The Lunchbox provided data that showed that those restaurant businesses that allow customers to pay using their preferred digital ordering method such as kiosks, apps, voice assistants, or wearables, have 14% higher check sizes than those restaurants that have the usual payment methods. Technology is developing on a daily basis and diners want to experience its convenience in every possible way.
Source: Lunchbox
14. More than 50% of restaurant professionals named food costs as a top challenge.
The restaurant industry is a challenging profession. According to the data by On the Line, 52% of restaurant professionals stated that high operation, as well as food costs, are the top challenges in the industry. It is definitely difficult sometimes to meet the real costs and expectations.
Source: On the Line
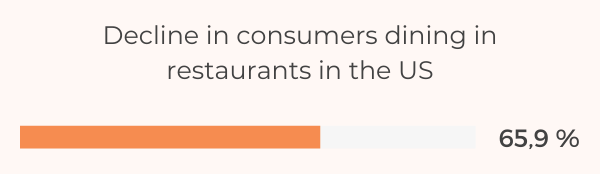
15. The pandemic negatively impacted more than 65% of diners.
COVID-19 pandemic has had a massive impact on the world and all industries, including the restaurant industry. Lockdowns affected a huge number of restaurants, but even then when the restrictions became a bit lighter, the damage has already been done. According to Statista, there was a 65.9% decline in consumers dining in restaurants in the US.
Source: Statista
16. From 1955 to 2019, the amount of money people spends on food increased by 26%.
If we take a look back in 1955 when the restaurant industry started to have a true bloom, dining out wasn’t that big of a deal. Then, the restaurant industry comprised 25% of the family food money. In 2019, that number increased to 51%. And that is a huge increase! However, if we take into account the number of restaurants that opened on a daily basis, people now have many more options regarding dining out than they had back in 1955.
Source: On the Line
17. The largest restaurant in the world has more than 6,000 seats.
To add a bit of fun fact, the Bawabet Dimashq Restaurant in Damascus, Syria, is the largest restaurant in the world. This family-owned restaurant has opened in 2002, and it has 6,014 seats and a 580,000 square-food dining area.
Source: Small Business
US Restaurant Industry Statistics
18. The US restaurant industry was valued at $659 billion in 2020.
The United States is often referred to as a fast-food giant. However, the country can definitely be named a restaurant giant too. The US restaurant industry was valued at $659 billion in sales for 2020, according to the National Restaurant Association. The initial projection was $899 billion, however, the industry incurred a loss of $240 billion due to the pandemic.
Source: National Restaurant Association and Finances Online
19. There are more than 204,000 fast-food restaurants.
The National Restaurant Association stated that there are over one million restaurants in the United States. Speaking of only fast-food restaurants, there are more than 204,000 of them in 2022, which is an increase of 1.3% from 2021. As we said, the United States is the food giant regarding the number of restaurants and fast-food chains.
Source: The National Restaurant Association and IBISWorld
20. There are 2.23 million people less working in the US restaurant industry.
Millions of people depend on working in the restaurant industry, however, the pandemic took its toll. The number of people employed in the US restaurant industry has significantly decreased in 2020 due to the pandemic. According to Statista, as of May 2020, there are 11.26 million employees in the industry. That is a decrease of 2.23 million people from the previous year.
Source: Statista
21. Decrease in retail sales means an increase in the restaurant industry.
Despite the pandemic and its massive impact on the world and all industries, US restaurant sales slowly return to a pre-pandemic growth path. According to the data provided by Statista and U.S. Census Bureau, retail and food services sales in the United States declined by 1.1% this year, which means it dropped down to $617.7 billion on a seasonally adjusted basis. With that being said, it is estimated that there is a higher number of consumers in restaurants.
Source: Statista and U.S. Census Bureau
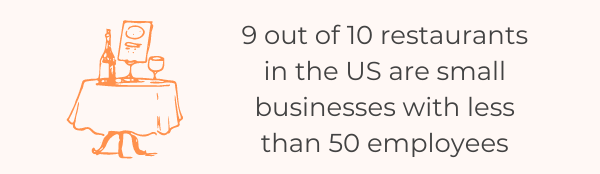
22. Most US restaurants are small businesses with up to 50 employees.
The data provided by Zippia, 9 out of 10 restaurants in the United States are actually small businesses with less than 50 employees. Such small businesses contribute to their communities with culture, character, and heart. More than 80% of such restaurant owners started in an entry-level position within the industry.
Source: Zippia and Why Tipping Works
23. COVID-19 closed 110,000 restaurants.
We already mentioned a couple of times how badly the COVID-19 pandemic had impacted the restaurant industry. According to Zippia, a total of 110,000 restaurant locations were temporary or permanently closed over the pandemic in 2020. That is a high number that perfectly shows the negative impact of the pandemic on business.
Source: Zippia
24. In the US restaurant industry works 10% of the nation’s workforce.
With more than 11 million people working in restaurants, such a high number is actually 10% of the nation’s workforce. 10% of restaurant employees had a median hourly wage of $11.47, while 90% of them earned less than $15.37%. And that is the reason why the restaurant industry is known for its high turnover employee rate.
Source: National Restaurant Association and Statista
25. Over 65% of restaurants increased their menu prices due to the minimum wage increase.
In order to improve the working conditions for restaurant employees, the minimum wage keeps increasing. However, such an increase actually affects the menu prices which increase in over 65% of the restaurants. Despite the increase for restaurant workers, they still work for a minimal paycheck while the food prices keep on increasing.
Source: The National Restaurant Associaton
Restaurant Sales Statistics
26. A newly opened restaurant earns up to $112,000 per month.
The exclusive Toast survey data stated in their restaurant success report for 2019 that a new restaurant that is opened for less than 12 months has an average monthly revenue of $111,860.70. We can’t help but wonder how did the pandemic impact such new businesses, especially when we’re talking about lockdowns.
Source: Toast
27. Restaurant Brand International had an 11% increase in sales.
According to QSRweb, Restaurant Brand International that owns 4 world’s most iconic quick-service restaurant brands Tim Hortons, Burger King, Popeyes, and Firehouse Subs, had a growth of 11% in sales in the third quarter in 2021. Quick service restaurants have seen a big increase in sales and popularity in the last couple of years.
Source: QSRweb
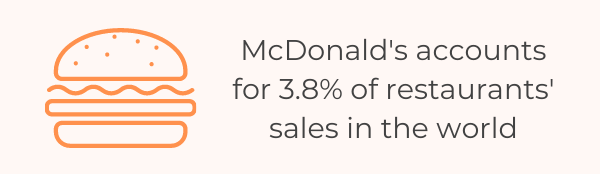
28. McDonald’s accounts for almost 4% of restaurant sales in the world.
We already mentioned that McDonald’s is the most valuable brand in the world. But not only that, the restaurant chain is amongst the worthiest restaurants in the world. According to Opportimes, McDonald’s accounts for 3.8% of restaurants sales in the world. It is enough to say that McDonald’s sells 75 burgers every second. That is 4500 burgers a minute and 270,000 an hour.
Source: Opportimes and Mashed
Restaurant Online Ordering & Delivery Statistics
29. Online food delivery generates more than $26.5 billion.
During the ongoing pandemic, many restaurants needed to close their doors or to serve just a couple of customers who weren’t afraid of getting COVID-19. However and due to that, many consumers simply took a different road of getting and consuming their favorite food – by online ordering and delivery. According to Fundera, the online food delivery industry generates more than $26.5 billion.
Source: Fundera
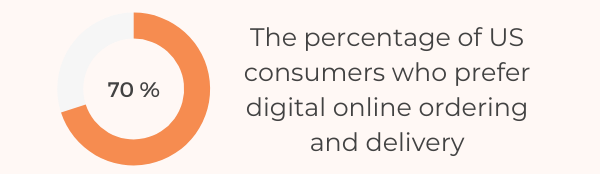
30. Almost three-quarters of US consumers prefer digital online ordering.
The data provided by Lunchbox stated that 70% of US consumers prefer digital online ordering and delivery. And that is not only the most convenient method for them but also the safest due to the ongoing COVID-19 pandemic.
Source: Lunchbox
31. Restaurants with technology are more likely to have a high traffic of customers.
Technology definitely eases up the entire life, not only the restaurant business. And according to 30% of US consumers, technology options make it more likely they’ll order delivery food from the comfort of their home. Who even wants to go into the crowds during this time.
Source: Lunchbox
32. Almost 80% of people have a restaurant app for online ordering.
Now, the pandemic has brought a big change in the restaurant industry where the demand for websites, social media profiles, and apps grew enormously. According to the data by Lunchbox, with pandemic shifts, 79% of people have a restaurant app, 48% follow a social media account from a food brand or restaurant, while 21% of people have chosen to order from a restaurant or fast food based on their social media posts or photos.
Source: Lunchbox
33. Around 57% of people have a third-party delivery app.
A third-party delivery app also had a massive increase in popularity and downloads. The data from the report by Lunchbox says that due to the pandemic, 57% of people have a third-party delivery app. Such apps allow you to order not only from various restaurants and fast food brands but also groceries and almost anything that comes to your mind.
Source: Lunchbox
34. Contactless delivery is a must for 71% of consumers.
According to a Deloitte industry report, 68% of people order takeout more than once a month, while 52% of them order delivery more than once a month. The report states that both of these percentages show a 14% increase during COVID-19. Social distancing and cleanliness are very important to a lot of consumers and 71% of them request contactless delivery.
Source: Deloitte
35. Meal kits are desirable for more than 50% of consumers.
Meal kits have been very popular for quite some time now. They are a convenient and less expensive meal than dining out. The National Restaurant Association stated that more than 50% of consumers would purchase a meal kit if their favorite restaurant offered it. 50% of consumers would buy groceries such as fresh and uncooked food with meat, dairy, bread, or pasta, from the restaurants if such options were available.
Source: National Restaurant Association
36. About 75% of Millennials and Gen Z would like to purchase a meal kit from a restaurant.
Speaking of meal kits, Millennials and Gen Z are quite interested in them too. 75% of them are likely to purchase a meal kit in case their favorite restaurant offers it. A meal kit is a convenient way for those who don’t like to spend hours in the kitchen, don’t have time, or aren’t that handy with cooking.
Source: National Restaurant Association
37. People are more likely to order directly from restaurants than from a third-party app.
Despite the fact that third-party sites such as Grubhub are really popular in the last couple of years, especially since the pandemic, the data provided by On the Line stated that when placing an online order, people are more likely to use a restaurant’s website and not a third-party sites.
Source: On the Line
38. Almost 50% of restaurant professionals don’t like third-party apps.
Not only do consumers prefer to order directly from the restaurants but restaurant professionals love that option too. According to Fundera, 43% of such professionals believe that third-party apps actually interfere with a direct relationship with the restaurants’ customers. Without that specific bond between a restaurant and a customer, the business can be damaged.
Source: Fundera
39. Restaurants with third-party delivery platforms had only 12% of delivery orders.
The Supply Chain Dive reported that restaurants that have their own couriers had 44% of delivery orders, while those that used third-party delivery platforms only had about 12% of such orders. That is a big difference between these 2 delivery options.
Source: Supply Chain Dive
40. Speed is the most important factor regarding online food ordering.
When talking about online food ordering, most people would think that the quality of the food is the most important factor. However, On the Line data stated that the most important factor is actually the speed of delivery, followed by a value, and then on the third place is the quality of the food.
Source: On the Line
41. Digital ordering has grown by 300% since 2014.
Even though the pandemic has massively increased the popularity of digital ordering and delivery, that rate has actually been growing since 2014. The Nation’s Restaurant News reported that digital ordering has grown by 300% in the last 7 years, compared with dine-in traffic. That is a huge increase in online ordering and delivery. However, such growth goes hand in hand with technology development too.
Source: Nation’s Restaurant News
42. Ordering from a website is preferable for 57% of the customers.
Besides using restaurants’ apps or third-party delivery apps, direct ordering from a restaurant’s website also grows in popularity. According to the data provided by Toast Tab, online orders from a website are growing in popularity and usage, and 57% of customers prefer to order by using that method. It definitely is the easiest way of ordering food.

Source: Toast Tab
43. More than 50% of Americans order take-out food up to twice a week.
Americans are often referred to as the biggest fast-food consumers. The study conducted by KitchenToast found out that 55% of Americans order take-out food or delivery once or twice a week. And 4 out of 5 Americans do that because they are lazy and don’t feel like cooking.
Source: KitchenToast
44. By 2023, almost 54 million people will use food delivery apps.
With an ongoing COVID-19 pandemic, Statista estimated that by 2023, the number of smartphone food delivery app users in the United States is expected to increase to 53.9 million. In 2020, that number was 45.6 million. That is a huge increase for only a 3 year time period.
Source: Statista
45. In the US, 67% of consumers prefer to order over a restaurant’s app or website.
We already stated that people prefer to use a restaurant’s own app or website for food delivery. And 67% of consumers in the United States are here for it. The biggest disadvantages of such food delivery services are often the low quality of the food which may get cold, the delivery is often late and it may cost some money.
Source: Statista
46. Online food delivery service is estimated to grow in its worth.
With the ongoing pandemic and technological development, it is estimated that the online food delivery service will grow even more in its worth and popularity. According to Fundera, by 2024, this industry may be worth $32 billion.
Source: Fundera
Fast Food Restaurant Statistics
47. It is estimated that the global fast-food industry’s revenue will exceed $885 billion in 2021.
According to SpendMeNot, 2021 was an excellent year for the fast-food industry. The available data estimates that the industry’s revenue exceeds $885 billion. There was never a single doubt about the popularity of fast food during these tough times. And the revenue will surely grow even higher in 2022.
Source: SpendMeNot
48. The fast-food sector accounts for more than 50% of sales in the restaurant industry.
The fast-food industry is referred to as QSR, Quick Service Restaurants. This sector accounts for more than 50% of sales in the entire global restaurant industry. This is an enormous share of the total sales in such food industry and it only shows a small piece of the popularity of fast food.
Source: Franchise Help
49. Quick Service Restaurants are popular on Twitter.
Fast food is everywhere we look. And it isn’t surprising it is present in social media too. According to Statista, Twitter is the most usual place where you’ll see fast food in some form. The data states that quick-service restaurants get 57% of the over 1 million Twitter mentions. Being present on social media highly contributes to the increase of the consumers of such food.
Source: Statista
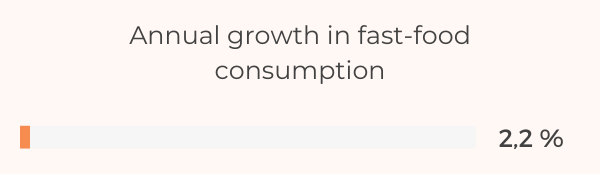
50. Consumption of fast food has an annual growth of 2.2%.
The data provided by Budget Branders showed that fast-food consumption has been increasing over the last few years. Every year, there is a rough growth of 2.2%. It is estimated that this growth will increase even more in the upcoming years, especially due to the pandemic and the growing popularity of fast-food online ordering and delivery.
Source: Budget Branders
51. Americans consume the most fast food.
We already mentioned that the United States is often referred to as a fast-food giant. And Americans truly do consume junk food more than the rest of the world, especially due to the fact they have a various selection of fast-food brands to go to. According to Supplements101, France is in second place, while Canada follows in third.
Source: Supplements101
52. Americans love their pizza.
Pizza is amongst the most popular fast food in America. And it is guilty of more than 80% of overweight problems. According to data by Slice, the average American eats 40 pizzas a year. That is 23 pounds. Americans order 3 billion pizzas per year and spend a total of $38 billion.
Source: Slice
53. Kids can choose a healthier meal at 30% of the fast-food restaurants.
Kids shouldn’t be exposed to fast food too much because it can definitely negatively impact their bodies and health. However, only 30% of fast-food restaurants offer healthier items on kids’ menus. However, healthier options usually go without noticing because of the other, bigger list of all the unhealthy meal options.
Source: Reuters
54. Americans account for 18% of global fast-food sales.
Did we already mention that Americans are the biggest consumers of fast food in the world? Well, here is one more fun fact about that statement – Americans make 18% of all worldwide fast-food sales. That is a huge percentage, especially due to the fact that fast food is such an unhealthy meal option.
Source: Renolon
55. Women consume less junk food than men.
The research conducted by Barbecue Lab found out that men consume more fast food than women. According to the data from the research, 38% of men consume fast food on any given day, compared with 35.4% of women that do so. The data also showed that young men are particularly big fast-food consumers.
Source: The Barbecue Lab
Restaurant Marketing Statistics
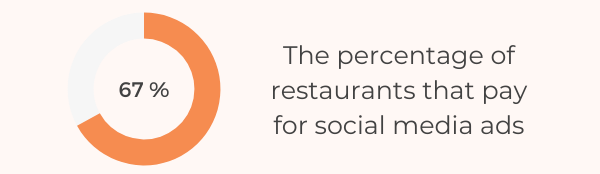
56. Most restaurants pay for social media ads.
Today, marketing is extremely important for all businesses, including the restaurant industry. On the Line provided data on such matters and according to that, 67% of restaurants pay for social media ads, 42% pay for Google or search engine ads, and 32% pay for magazine or newspaper ads. On the Line also stated that 53% of restaurants pay for community, event, or charity sponsorships.
Source: On the Line
57. Online content influence 86% of Millennials.
Speaking of the social media ads, such a marketing approach definitely has the biggest influence on people, especially Millenials. The Lunchbox data stated that 86% of Millennials try a new restaurant once they see fast food, quick service, food-service, or full-service restaurants content online or on social media. That’s why it is important for a restaurant to have social media profile or website.
Source: Lunchbox
58. Most restaurants use Facebook and Instagram.
When it comes to social media and marketing, restaurants are most likely to use Facebook – 91% of them have profiles there. Instagram is in second place and there, 78% of restaurants post content. According to On the Line, Instagram’s popularity has extremely grown regarding restaurant promotion since the previous year when only 24% of restaurants were using it.
Source: On the Line
59. Only 14% of restaurants use YouTube for promotions.
The data provided by On the Line stated that even though the restaurant industry is present in almost every sphere of technology, social media, and channels, the industry is least likely to use YouTube for promotions. The available data showed that only 14% of restaurants use YouTube for posting content in order to achieve a good promotion.
Source: On the Line
60. Online marketing influences 1 billion consumers.
Everyone knows that online marketing massively influences people and their decisions. The same goes when we’re talking about marketing for the restaurant industry. According to Monetate data, over 1 billion restaurant visits are made by consumers who were influenced by online marketing. That is a huge number of influenced people – and new customers!
Source: Monetate
61. More than 80% of people trust online reviews.
Many people don’t know that online reviews are a part of marketing and they sometimes have an even higher influence on people than classic approaches. Bright Local reported that 84% of people trust online reviews as much as personal recommendations for dining decisions. Due to that, it is important for a restaurant to have positive reviews in order to attract consumers. A good word goes a long way.
Source: Bright Local
62. Restaurant consumers love getting responses on social media.
Any action on social media made by a restaurant is considered to be marketing and promotion. It only depends on whether it is good marketing or a bad one. According to Forbes, a response on social media is a good way for restaurants to gain more customers. 71% of consumers stated that they’re more likely to recommend a restaurant that responds quickly to them on social media.
Source: Forbes
63. Facebook is a helpful restaurant guide for 75% of people.
When it comes to deciding on where to wine and dine, most consumers use Facebook for help. The data provided by Social Media Monthly stated that 75% of consumers used Facebook to decide on what restaurant to eat at. The same data says that the influence of Facebook on purchasing decisions is increasing higher and higher.
Source: Social Media Monthly
64. More than half of Facebook users want a special promotion for following the restaurant’s page.
The Hubspot reported that 58% of Facebook users expect a special promotion or an offer for becoming a fan of a restaurant page. This isn’t an innovative approach, for example, many restaurants offer discount coupons through their apps or secret promotion through their newsletter. Some restaurants probably do have some type of promotions directed only to their fans and followers.
Source: Hubspot
65. Instragam is the number one social media app for restaurants.
If we’re talking about engagement with restaurant brands, Instagram is the best platform to go with. Track Maven stated that Instragam is the number one social media app for engagement with restaurants. Instagram is probably the easiest way for a restaurant to get to its followers and to present them the food, wine, flavors, and seasonings. And restaurants will most likely give their followers responses to their questions, according to Track Maven.

Source: Track Maven
66. Instagram is better for fast-food restaurants.
Track Maven did a comparison between fast food brands and full-service restaurants. According to their study, fast food brands perform better on Instagram, than full-service restaurants. Fast food places have a 21.4% engagement ratio, while classic restaurants have an 18.4% engagement ratio.
Source: Track Maven
67. About 20% of restaurants don’t have a website.
Today, marketing mainly goes through online platforms. And it is important for a restaurant to have an official site with all the important info. It is amazing that 80% of the restaurants do have a website and that is a great way to promote and post specific and unique content. However, it is a bit shocking that 20% of restaurants still don’t have a website. Especially in these times when technology is greatly used in any type of industry.
Source: Modern Restaurant Management
68. Almost 70% of restaurants pay for social media ads.
Speaking of marketing and online platforms, social media has a key role in the promotion and that is through social media ads. Even though this may be the latest trend since social media is a relatively young platform, social media ads are a great way to attract more visitors to restaurants. According to NetWaiter, only 33% of restaurants are not paying for ads on social media. But hopefully, they do have profiles on such platforms for engagement with their current and future consumers.
Source: NetWaiter
Restaurant Employment Statistics
69. Millions of Americans had their first job in a restaurant.
The data provided by On the Line stated that 1 in 3 Americans had their first job experience in restaurants. We already mentioned that restaurant employees make up 10% of the overall US workforce. According to On the Line, 6 in 10 adults have worked in a restaurant at some point in their life. That is a huge number of Americans who experience this hard job.

Source: On the Line
70. By 2029, there will be 5 million more restaurant employees.
The United States has millions of people working at full-service restaurants and fast-food restaurants. And for now, the industry has a little over 11 million restaurant workers. According to On the Line, by 2029, there will be 16.9 million jobs in the restaurant industry.
Source: On the Line
71. The employee turnover rate in the restaurant industry is 75%.
Turnover employee rate is a big problem in the restaurant industry, especially in the fast-food sector. If we’re talking about the restaurant industry, the turnover is high at 75%. When it comes to the fast-food sector, the turnover rate is 150%. Employee turnover rate presents a percentage of people who are replaced on their job position due to quitting. The restaurant industry can be a pretty harsh environment to work within.
Source: On the Line and Mashed
72. With a high turnover rate, restaurants are losing money.
Speaking of a high turnover rate, the industry is losing money with every employee who leaves. On the Line, data stated that it can cost up to $2000 to hire and train a new staff member. Now, imagine that amount of money for the turnover rate of 75% or in the fast-food industry – 150%. However, people do have good reasons to leave, especially if we’re talking about minimal wage.
Source: On the Line
73. Restaurants need $15,000 for new managers.
Besides looking for, hiring, and training new staff, restaurants are having problems with finding new managers and training them. That action can cost up to $15,000 and because of that, the restaurant owners are highly concerned about turnover and cost-effectiveness.
Source: On the Line
74. More than 50% of restaurant employees are men.
The data provided by On the Line stated that, unlike other industries, restaurants employ more women and minority managers. In the United States, 46.4% of all restaurant managers are women, while 50.1% are men. What is interesting is that in 2021, women earned 96% of what men earned in the same industry.
Source: On the Line and Zippia
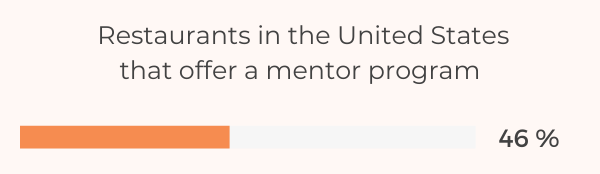
75. Almost 50% of restaurants offer a mentor program.
If a restaurant has formal or informal mentorship strategies, it can be a career destination where people would love to come and stay. According to On the Line, 46% of restaurants in the United States offer a mentor program for their employees in order for them to learn easier and with a good and helpful mentor.
Source: On the Line
76. More than 50% of restaurants offer food safety certification training.
According to the data provided by On the Line, 53% of the restaurants do have food safety and alcohol certification training. When it comes to such training, it is important for new staff to learn and know the best protocols regarding food and alcohol. Food safety is an especially important field to understand and know for everyone working in the restaurant industry.
Source: On the Line
77. Men make more money than females.
The topics about male and female salaries have always been in the focus. Even though today, a lot of industries try to equal the numbers, the difference is still there. According to Data USA, the average male salary in the restaurant industry is $25,979, compared with a female salary of $25,523.
Source: Data USA
78. Only 5% of the US restaurant employees are unhappy with their role.
The restaurant industry is a tough one. And working with people, mostly on the minimum wage, is hard. According to QSR data, 5% of the employees said there were unhappy with their role in the US restaurant industry. That is an extremely low percentage of unhappy people, especially due to the fact they work in such tough conditions. However, being unhappy with the role only means that such people are willing to work hard, learn more, and advance to a new and more challenging working position.
Source: QSR
79. There are more than 4,7 million fast-food workers in the US.
The United States, as the fast-food giant, has 4,791,005 people employed in fast-food restaurants. That number has increased in the last 5 years by 2.4%. According to Deals On Health, California has the most fast-food employees. There, over 100,000 people work in quick-service restaurants.
Source: Deals On Health and IBISWorld
80. More than 50% of fast-food employees need a public assistance program.
If we’re talking about the restaurant industry, the fast-food sector is the toughest one to work in. Reuters reported that over 50% of fast-food employees rely on public assistance programs. Due to their minimum wage (the average fast-food worker in the US earns $11 per hour), many front-line fast-food employees simply can’t make enough money for a living, while their long shifts make it difficult for them to find a second job.
Source: Reuters
Restaurant Consumer Statistics
81. Almost 50% of people eat out multiple times a week.
The data by On the Line stated that a high number of people, 45% of them, go out to eat multiple times a week. On the other hand, 20% of diners go out to eat once a week. These are really high percentages of people who don’t prepare homemade meals, but simply go out and enjoy themselves and professional cuisine more times a week. However, we need to take into account the fact that many people don’t have time to cook or it is more convenient and easier for them to just go and dine out.
Source: On the Line
82. Americans eat around 18.2 meals in restaurants per month.
A lot of Americans love to eat out. According to The Simple Dollar, an average American eats approximately 4.2 commercially prepared meals per week. If we look at the nation, Americans eat out between 4 and 5 times a week. On a monthly basis, that number equates to 18.2 meals eaten in restaurants. And out of the total number of days in a month, that is a lot of meals eaten outside the house.

Source: The Simple Dollar
83. Almost 80% of Millennials are willing to spend money on restaurant meals.
Millennials love to eat out too. 78% of them stated that they would rather spend money on an experience such as a restaurant, than on purchasing an item from a store. However, the research conducted by KitchenToast found out that 80% of Millennials cook 3 or more days a week. Most of them do that because it is cheaper and healthier.
Source: On the Line and KitchenToast
84. About 61% of diners are more likely to eat healthy at a restaurant.
Healthier meal options are now in focus more than ever. According to the data collected by On the Line, 61% of diners say they are more likely to eat healthy at a restaurant than they were two years ago. However, such meals are often more expensive than others so that too must be taken into account while deciding on whether to eat out or prepare a homemade meal.
Source: On the Line
85. Breakfast is a thing.
If we’re talking about a specific meal that is most often consumed in a restaurant, diners love breakfast and according to them, they would love to eat it all day long. On the Line reported that 55% of people would love to order breakfast items at any time of the day if they were offered.
Source: On the Line
86. Americans spend 12.5% of their income on food.
The restaurant industry is a multi-billion-dollars worth industry. If we only look at the United States, Americans spend 12.5% of their income buying food. And as we already mentioned, Americans don’t have a habit of preparing and cooking homemade meals, but on the contrary – eating out is the habit for most of them. And they could use pretty well that 12.5% of the income on preparing food, not combining a couple of homemade meals with take-out.
Source: BLS
87. Millennials spend 44% of their food budget on eating out.
As we already stated, Millennials are more likely to spend money in a new restaurant, than on buying some item from a store. According to Forbes, Millennials spend 44% of their food budget at restaurants. That is a high amount of money spent only to dine out. And dining out is an expensive habit to nurture.
Source: Forbes
88. US consumers eat take-out food up to twice a week.
Visiting a restaurant isn’t the only way to consume professionally prepared meals. Delivery and takeout are quite popular activities too. Data provided by Upserve stated that 60% of US consumers order delivery or takeout once a week. On the other hand, the KitchenToast research found out that 73% of full-time employed people in the United States order take-out food up to twice a week. Even though there’s take-out food twice a week at the table, it is still better and healthier than multiple times a week.
Source: Upserve and KitchenToast
89. People spend at least $50 when ordering food online.
The biggest problem when consuming a restaurant meal, or in this case, a take-out or food delivery, is the fact that most people think it is cheaper than buying groceries and preparing a homemade meal. Even though ordering food requires less time than preparing it, this action takes a lot more money than people think. The Upserve data stated that 34% of consumers spend at least $50 per order when they’re ordering food online. And that is a lot for such a meal!
Source: Upserve
90. Americans spend $258 on eating out each month.
When we’re talking about the restaurant industry, we simply must mention the Americans’ eating habits. According to the Bureau of Labor Statistics, the average American household spends over $3,100 on eating out every year. If we’re talking about eating out on a monthly basis, that is $258 each month spent on restaurants, fast food, or some other option of eating away from home. Due to that, no wonder that the American restaurant industry is booming.

Source: Bureau of Labor Statistics
91. Americans consume fast food worth $200 billion.
Almost half of the mentioned money spent on eating out is spent on fast food. Data provided by Renolon stated that $1200 is spent per person on fast food each year. In a lifetime, that would be $70,500 spent only on consuming fast food. If we look at the entire nation, Americans spend roughly around $200 billion on fast food every single year.
Source: Renolon and Budget Branders
92. About 31.7% of people with lower income love to consume junk food.
Speaking of fast food, the study made by Budget Branders stated that people with higher income are more likely to go and consume junk food. The study showed that 42% of those who earn more money on a monthly basis will go out and consume some type of fast food meal. 36.4% of people with middle income are likely to consume such food, while 31.7% of people with lower income will go out and eat junk food.
Source: Budget Branders
To Wrap It Up
The restaurant industry is worth billions and billions of dollars. Despite the pandemic and its impact on the economy and all industries, this sector is blooming thanks to the options of online ordering and delivering. Today, we mentioned and discussed all the statistics and data that you need in order to understand how big and popular this industry is. We covered the topic from all the aspects, including those from employees and consumers. There is no doubt that the restaurant industry will increase in its value and popularity in the upcoming years too, especially once the COVID-19 pandemic is over.