
USDA, the U.S. Department of Agriculture, works to increase food security and reduce hunger for American people at more than 4,500 locations across the country and abroad. The organization provides children and low-income people access to food, as well as a healthful diet and nutrition education in order to support American agriculture.
What does USDA data state about food insecurity in the USA? How many households don’t have enough food on a daily basis?
In today’s article, we’re going to answer these and many more questions. Keep on reading to find out everything you need to know about food insecurity in the United States.
4 Important USDA Hunger Statistics (Editor’s Pick)
- 10.5% of the households were food insecure in 2020.
- In 7.6% of households, both adults and children were food insecure.
- The rates of food insecurity were higher for households with children.
- 12.3% of the population in the South was food insecure during 2020.
11 USDA Hunger Statistics
1. The US had 5.1 million households with very low food security.
In the USA, the prevalence of food insecurity hasn’t changed between 2019 and 2020. 89.5% of the US households were food secure in 2020. 10.5% of the households were food insecure at some point during that year. That percentage includes 3.9% of people or in number, 5.1 million households, that had very low food security.
Source: USDA, Economic Research Service
2. In 2020, 35.3% of food-insecure households had incomes below the Federal poverty line.
We talked many times about the connection between poverty and hunger. Economic factors impact people so their low incomes aren’t enough to get them through. For 35.3% of households in the US, that means food shortages, as well as food insecurity. Such people don’t know when will they have food on their table. Besides, they often need to choose between paying for food, housing, and medical care since they can’t afford all of that.
Source: USDA, Economic Research Service
3. Food insecurity rates are highest for single-mother households.
According to the survey conducted by USDA, U.S. Department of Agriculture, the food insecurity rates in 2020 were the highest for single-mother households, as well as for the already mentioned households with incomes below the poverty line. As we said, poverty and low incomes are closely connected with food insecurity, hunger, and starvation.
Source: USDA, Economic Research Service
4. In 7.6% of households, both adults and children experienced food insecurity.
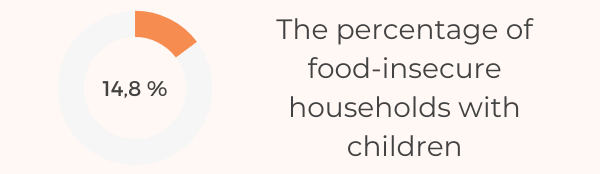
The USDA survey for food insecurity in 2020 stated that 14.8% of households with children were food insecure. In around half of such food-insecure households with children, only the adults experienced food insecurity, while 7.6% of households with children, both adults and children were food insecure sometime during that year.
Source: USDA, Economic Research Service
5. Both adults and children of 322,000 US households experienced very low food security.
Food insecurity is a big problem in the United States. In 2020, in 0.8% of the US households with children, or in number, 322,000 households, both adults and children experienced instances of very low food security. That means that the people’s eating patterns were disrupted, meals were skipped, and food intake was reduced because such households simply couldn’t afford enough food to feed all the members of the family.
Source: USDA, Economic Research Service
6. In 2020, the USA had 38.3 million people living in food-insecure households.
According to the USDA survey, 38.3 million people lived in food-insecure households in 2020. Out of this high number, 9.4 million adults lived in households with very low food security. 6.1 million children lived in food-insecure households where both children and adults were food insecure.
Source: USDA, Economic Research Service
7. The prevalence of food insecurity varied considerably among household types.
Of course, the prevalence of food insecurity depends on the type of household too. The rates of food insecurity were higher for households with children (14.8%), households with children under age 6 (15.3%), households with children headed by a single woman (27.7%), or a single man (16.3%). The high food insecurity was also in the households with incomes below 185% of the poverty threshold (28.6%).
Source: USDA, Economic Research Service
8. Households with children are more likely to be food insecure.
According to the survey conducted by the USDA, households with children had a substantially higher rate of food insecurity than those without children. 14.8% of households with children were food insecure compared with 8.8% of those without them. It is definitely harder to provide food for more than 2 people so it isn’t that surprising that households with more members (children) had a hard time finding food.
Source: USDA, Economic Research Service
9. About 9.5% of married-couple families are food insecure.
Speaking of the households with children and their struggles with food insecurity, at the bottom of the list, are married couples. They have the lowest rate of food insecurity amongst the households with children that are trying to put food on their table every single day.

Source: USDA, Economic Research Service
10. The South has a higher rate of food insecurity.
If we look at the regional levels of the United States, according to the data provided by the USDA, the highest rate of food insecurity was in the South. 12.3% of the population there was food insecure during 2020. Compared with Northeast where there was 9.3% of the food-insecure population, while on West and Midwest, there was 9.5% of the population fighting food insecurity.
Source: USDA, Economic Research Service
11. In nonmetropolitan areas, there were 11.6% of food-insecure people.
The prevalence of food insecurity, according to the USDA survey, was higher in food households located in nonmetropolitan areas. There, 11.6% of people were suffering from food insecurity. In principal cities of metropolitan areas, 12.7% of people were food insecure, while in suburban and other metropolitan areas outside principal cities, there were 8.8% of food-insecure people.
Source: USDA, Economic Research Service
To Wrap It Up
USDA, the U.S. Department of Agriculture, helps people who are suffering food insecurity, as well as those who are at the edge of poverty due to their low incomes. The organization conducts an annual survey for food insecurity trying to increase awareness of this national problem. Despite the effort, there are still millions of American people fighting food insecurity and the main drivers of this problem are the economy and low incomes. Due to that, people simply don’t have enough money for a normal food-secure life. However and hopefully, once the COVID-19 pandemic is over, there will be an increase in food security too.